
کد رسم منحنی Bezier در متلب
- ◷ 1393/01/14
- دیدگاهها برای کد رسم منحنی Bezier در متلب بسته هستند
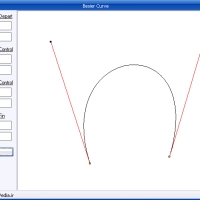
در این پست سورس متفاوتی از برنامه رسم منحنی بزیر (Bezier) در متلب را خدمت شما ارایه می دهیم. این برنامه در متلب نوشته شده و رابط کاربری (GUI) نیز برای آن تهیه شده است.
Bezier
منحنی Bézier یک نوع منحنی پارامتریک می باشد که درعلوم گرافیکی و دیگر علوم کاربرد دارد. توسعه منحنای Bezier به سطوح Bezier می انجامد. در علوم گرافیک برداری، منحنی های Bezier جهت مدلسازی منحنی های هموار بکار می روند. این منحنی ها میتوانند دارای درجه های مختلفی باشند. درجه (مرتبه) نیز برای آنها تعریف می شود. این منحنی ها همچنین در انیمیشن سازی جهت کنترل حرکت بکار می روند.
این برنامه قابلیت افزودن نقاط، ویرایش آنها و حذف آنها را دارد. همچنین می توان محدوده محورها (Axis) را مشخص نمود.
در پست های قبل چند نمونه کد جهت رسم این منحنی قرار داده بودیم:
نرم افزار رسم منحنی بزیر (Bézier curve)
Bezier Curve Drawing in MATLAB – GUI
سورس کامل این برنامه بصورت زیر می باشد. این برنامه با Function نوشته شده است.
% ******************************************
% EngPedia.ir
% ******************************************
function bezierGUI
figure(‘un’,’n’,’pos’,[.1 .1 .8 .8],’numbert’,’off’,’menub’,’non’,…
‘name’,’Bezier’)
axes(‘un’,’n’,’pos’,[.05 .05 .8 .9],’buttondownfcn’,@go)
e1 = uicontrol(‘style’,’ed’,’un’,’n’,’pos’,[.88,.1,.08,.05],…
‘backgroundc’,[1,1,1],’string’,’0 5′,’fonts’,10,’fontn’,’courier’,…
‘callback’,@che);
e2 = uicontrol(‘style’,’ed’,’un’,’n’,’pos’,[.88,.05,.08,.05],…
‘backgroundc’,[1,1,1],’string’,’0 10′,’fonts’,10,’fontn’,’courier’,…
‘callback’,@che);
uicontrol(‘sty’,’text’,’un’,’n’,’pos’,[.86,.045,.02,.05],…
‘string’,’y’,’fonts’,12,’backgroundc’,get(gcf,’color’))
uicontrol(‘sty’,’text’,’un’,’n’,’pos’,[.86,.095,.02,.05],…
‘string’,’x’,’fonts’,12,’backgroundc’,get(gcf,’color’))
uicontrol(‘style’,’text’,’un’,’n’,’pos’,[.86,.15,.1,.025],…
‘backgroundc’,[1,1,1],’string’,’Axes Limits’,’fonts’,10,…
‘fontn’,’courier’,’backgroundc’,get(gcf,’color’));
uicontrol(‘style’,’push’,’un’,’n’,’pos’,[.86,.375,.1,.05],…
‘backgroundc’,[1,1,1],’string’,’Reset’,’fonts’,10,’fontn’,’courier’,…
‘callback’,@gg);
% reset button simply closes and reopens the GUI
function gg(varargin)
close(gcf)
bezierGUI
end
hg = uibuttongroup(‘un’,’n’,’pos’,[.86,.2,.1,.15],…
‘fontn’,’courier’,’fonts’,10);
h1 = uicontrol(‘sty’,’radio’,’parent’,hg,’un’,’n’,’pos’,[0,1/3,1,1/3],…
‘string’,’Edit’);
h2 = uicontrol(‘sty’,’radio’,’parent’,hg,’un’,’n’,’pos’,[0,2/3,1,1/3],…
‘string’,’Add’);
uicontrol(‘sty’,’radio’,’parent’,hg,’un’,’n’,’pos’,[0,0,1,1/3],…
‘string’,’Delete’);
set(findobj(‘style’,’radiobutton’),’fontsize’,12)
% changing the x or the y limits
function che(varargin)
xlim(str2num(get(e1,’string’))); %#ok<*ST2NM>
ylim(str2num(get(e2,’string’)));
end
% original points
P = [0 0; 1 5; 3 2; 5 10];
% create an initial plot
bemain(P)
% pressing on the axes
function go(varargin)
% get points on axes
xx1 = get(findobj(‘type’,’line’,’marker’,’o’),’xdata’);
yy1 = get(findobj(‘type’,’line’,’marker’,’o’),’ydata’);
p = double(vpa(get(gca,’currentpoint’),12));
% based on radio button chosen, do something different
% Edit
if get(hg,’selectedobject’) == h1
% get point closest to click
sst = (abs(p(1,1) – xx1) + abs(p(1,2) – yy1));
% change its x and y to match click point
P(sst == min(sst),:) = p(1,1:2);
% Add
elseif get(hg,’selectedobject’) == h2
% add point clicked to current points
P = [P;p(1,1:2)];
% Delete
else
% get point closest to click
sst = (abs(p(1,1) – xx1) + abs(p(1,2) – yy1));
% delete it
P(sst == min(sst),:) = [];
end
% draw the new Bezier curve with the new points
bemain(P)
end
% taken (comments included) from Bezier Curve Plotter by Sagar Aiya.
function bemain(P)
cla
che
Px = P(:,1);
Py = P(:,2);
% Number of points
r = 100;
% Calculate the Bezier curve
BezierCurve = bezier(Px,Py,r);
Bx = BezierCurve(:,1);
By = BezierCurve(:,2);
% Create figure
% Create axes
grid on
hold on
% Create plot
plot(Bx,By,’LineWidth’,1) %Bezier curve
plot(Px,Py,’ro’,’LineWidth’,1); % Control points
plot(Px,Py,’k-‘,’LineWidth’,1); % Lines between control points
end
% taken (comments included) from Bezier Curve Plotter by Sagar Aiya.
function BezierCurve = bezier(Px,Py,r)
% This function creates an Bezier Curve with r points and use’ the control points Px,Py
% Calculate the degree of the curve
n = length(Px)-1;
% Calculate the amount of change in the parameter u
du = 1/r;
% Calculate the binomial koefficienter
c = zeros(n+1,1);
bx = zeros(r+1,n+1);
by = zeros(r+1,n+1);
for i=0:n
c(i+1,1) = (factorial(n))/(factorial(i)*(factorial(n-i)));
% Calculate the Bernstein polynomium
for j=0:r
bx(j+1,i+1) = (c(i+1,1)*(j*du)^(i)*(1-(j*du)).^(n-i))*Px(i+1);
by(j+1,i+1) = (c(i+1,1)*(j*du)^(i)*(1-(j*du)).^(n-i))*Py(i+1);
end
end
Bx = zeros(r+1,1);
By = zeros(r+1,1);
% Calculate the Bezier Curve by sum up the Bernstein polynomials
for k=0:r
Bx(k+1,1) = sum(bx(k+1,1:n+1));
By(k+1,1) = sum(by(k+1,1:n+1));
end
% Output
BezierCurve = [Bx, By];
end
end
مطالب مرتبط

برچسب ها : Bézier, Bézier curve, curve, Matlab, رسم Bezier, رسم منحنی Bezier, رسم منحنی بزیر, کد Bezier, منحنی بزیر, نرم افزار رسم منحنی بزیر
دیدگاهتان را بنویسید
نشانی ایمیل منتشر نخواهد شد

مطالب جدید
- Mirion Genie 4.1 تحلیل طیف سنجی آلفا و گاما
- Imaris 11.1 تحلیل و پردازش تصاویر میکروسکوپی
- MOSES Wind Turbine 2026 طراحی و تحلیل توربین بادی
- AVEVA Historian v20 تحلیل داده های فرایندی در صنعت
- SafeSite 3G v7.28 تحلیل نشت مواد شیمیایی، آتش سوزی و انفجار
- Synopsys PowerX 2025R2 تحلیل ادوات نیمه هادی قدرت
- PHA-Tool 1.0.37 تحلیل خطرات فرایندی و ارزیابی ریسک صنعتی
- Mastercam 2026.R2 طراحی و برنامه نویسی ماشین کاری CNC
- Ansys TETK 2026 طراحی، اجرا و ارزیابی آزمون های ماموریتی
- RayXpert 2026 مهندسی هستهای، دوزیمتری و حفاظت پرتویی

مطالب پربازدید
- پکیج کامل استانداردهای صنعتی
- دانلود کتاب هیدرولیک و پنوماتیک فستو Festo فارسی
- دانلود فول استاندارد ASTM بصورت رایگان
- کلید فولاد (Key to Steel) پرتابل
- آموزش میکروکنترلر AVR
- دانلود آنتی ویروس شورتکات (Back 2 Normal)
- دانلود جدول استاندارد DIN
- دانلود کتاب آموزش Abaqus (فارسی)
- فول استاندارد ASME (بروز)
- دانلود نرم افزار MATLAB برای آندروید(MATLAB Android)

مطالب تصادفی
- Trios 5.11 اسکن و تحلیل حرارتی
- SAFR 2026 سامانه تشخیص چهره و بیومتریک هوشمند
- CFturbo 2026 R1 طراحی توربوماشین، پمپ، فن و کمپرسورها
- PASS Hydrosystem 4.7 R4 تحلیل هیدرولیکی و حرارتی شبکه های پایپینگ
- Ci Tools AC29 مجموعه پلاگین معماری و مستندسازی
- Aspen Geolog 2026 ارزیابی تخصصی مخازن نفت و گاز
- tnxCable 2.1 تحلیل سیستم مهاربندی برج های ارتباطی
- ProModel 10.14 شبیه سازی فرآیندهای صنعتی پیچیده
- DataPage+ 5.2 SP2 تحلیل آماری داده های اندازه گیری صنعتی
- SIDRA Intersection 11 تحلیل پیشرفته تقاطع و ترافیک

شبکه های اجتماعی
دانشنامه تخصصی مهندسی ایران را در شبکه های اجتماعی دنبال کنید


